[Gaille Energy Blog Issue 66]
This is a guest blog authored by Ankur Shah, one of my students at Rice University’s Graduate School of Business.
Royal Dutch Shell says the world could be grappling with a shortage of liquefied natural gas within a decade due to underinvestment in new projects. The Anglo-Dutch energy giant issued the warning in its second annual LNG outlook, which reports on developments in the booming market for natural gas cooled to liquid form for export. Shell says the market for LNG grew by 29 million tons last year, 30 percent more than previously expected. Trading in LNG reached 293 million tons in 2017, up from just 100 million tons at the turn of the century. At nearly 300 million tons, suppliers shipped enough LNG last year to power about 575 million homes, by Shell’s count. Tom DiChristopher, Shell warns of liquefied natural gas shortage as LNG demand blows past expectations (CNBC Feb. 26, 2018)
While pipelines between nations and continents have traditionally dominated the international gas trade, they offer limited options for rebalancing dynamic markets. If circumstances change, their owners can reverse directional flows or adjust capacity (by increasing or reducing compression). In contrast, LNG can respond to market conditions by sending gas to entirely new markets or spreading deliveries across multiple buyers.
The significance of this flexibility is illustrated by the shale revolution’s impact on the United States LNG market. The United States switched from importing to exporting LNG (Seeking Alpha, “Latest Trends In The Global LNG Market – A U.S. Perspective” (Apr. 23, 2018).

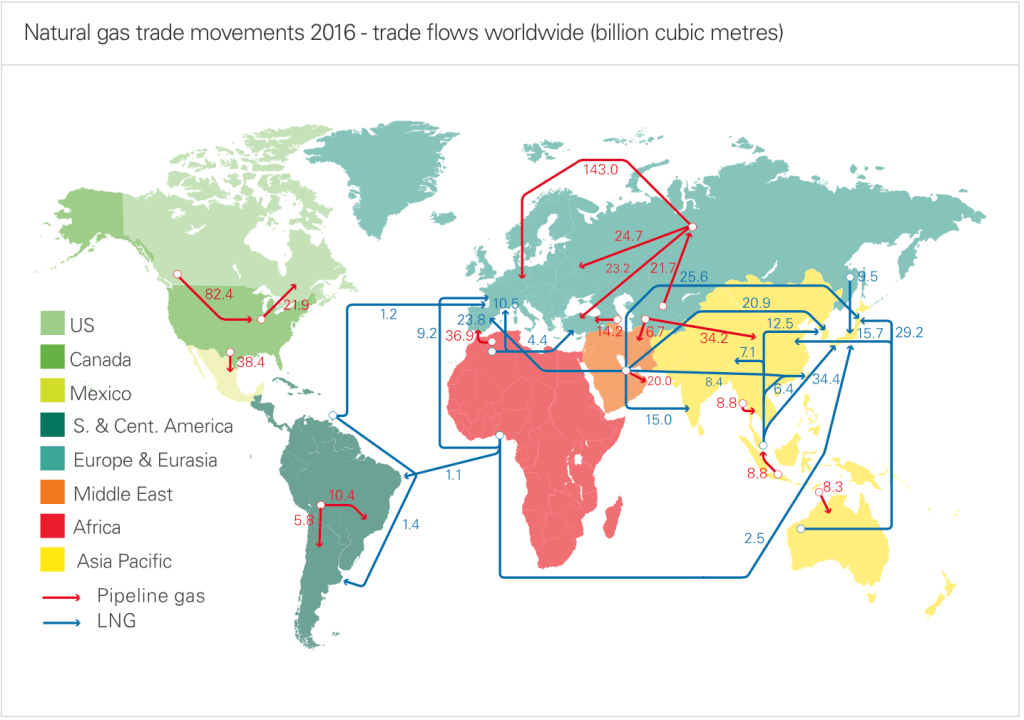
Meanwhile, Latin American and African (planned) LNG exports to the United States were diverted to Europe and Asia (see below figure from bp).
Notwithstanding this flexibility, LNG has faced challenges with respect to its cost profile.
The Cost of LNG
LNG consists of three stages, each of which incurs substantial cost:
- Step One: Liquefaction Plant
The first step in the chain for transporting LNG is a liquefaction plant. This plant requires an investment of $1.6 to $2 billion dollars for a plant capable of handling 500 million cubic feet per day. Assuming a real rate between 10 to 12 percent, this implies a cost of $1 to $1.30 per thousand cubic feet. Most studies also report costs in that range. Brito, D., & Sheshinski, E., Pipelines and the Exploitation of Gas Reserves in the Middle East (Baker Institute of Public Policy – Rice University 1997) (the “Rice Paper”).
- Step Two: LNG Vessels
The second step in the chain is the tanker. LNG must be transported at a temperature of -162 degrees centigrade and requires specialized vessels. These vessels cost $230 million for a 135,000 ton tanker. This is to be compared with a cost $85 million for a 280,000 ton VLCC. The reported shipping rates are $.20 per thousand kilometers or $.32 per mile (Rice Paper).
The below figure provides a further breakdown of vessel costs for various routes:

- Step Three: Regasification
The third step is regasification, which typically ranges between “$.35 to $.50 per thousand cubic feet” but can be “as high as $1.00 per thousand cubic feet” in Japan “due to the high cost of land” (Rice Paper).
The below figure from the Rice Paper shows the variable impact of shipping (Step Two) on delivered price, as a function of distance:

The Cost of Pipeline Transportation
The Rice Paper also examined the cost of transporting gas 1,000 miles through various sizes of onshore and offshore pipelines under assumes 15-year and 25-year project life, including the identification of the fixed cost as a percentage of the average cost (approximately half of onshore pipeline and three-quarters of offshore pipeline costs are fixed):
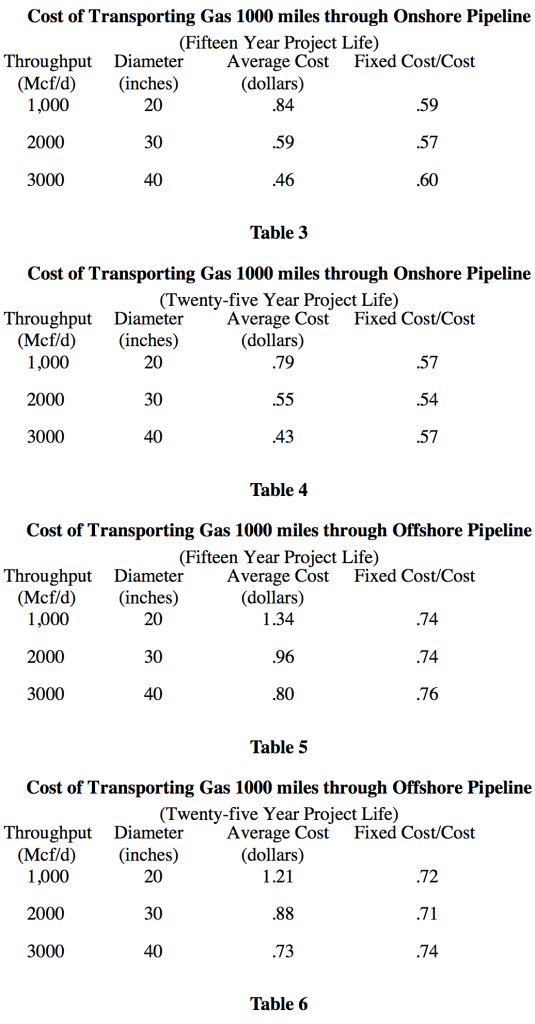
The Rice Paper assumed $40,000 per mile inch for an onshore pipeline and $100,000 for an offshore pipeline (in 1997), but INGAA data indicates pipeline fixed costs are continuing to increase.

Comparing the Cost of LNG to Pipeline Transportation
The Rice Paper plotted three curves for hypothetical pipeline cost profiles against LNG’s cost curve, revealing likely breakeven points:

More recent studies show even earlier breakeven points (~700 miles and ~2200 miles for offshore and onshore pipelines, respectively):

Technology Appears to Be Reducing LNG Costs
While LNG was initially used over very long distances (for which pipeline projects were not economically justified), technological advances appear to be shifting the breakeven toward shorter distances. The below figure shows how the LNG cost profile declined somewhat from the 1990s to the 2000s:

Additional technology driving further LNG cost reductions in the 2010s include:
- More efficient ship designs

- Lower United States liquefaction plant costs
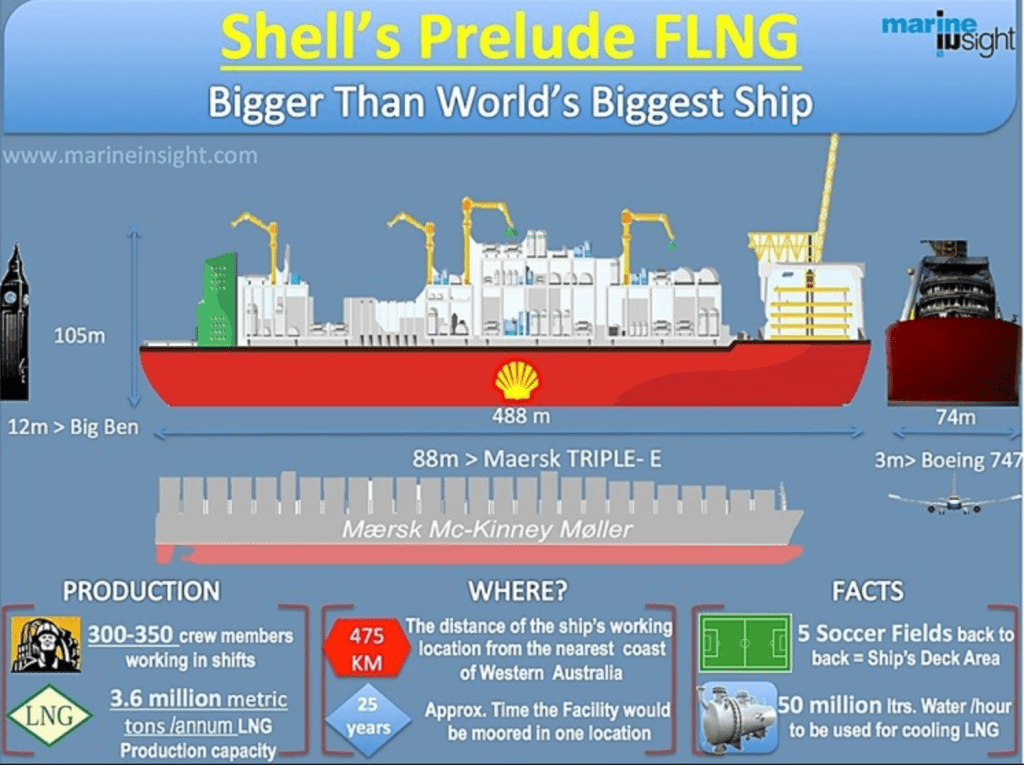
- Floating liquefaction
Floating liquefaction enables even more flexibility than traditional (onshore) liquefaction because the origination end of the LNG train also can be relocated in response to market or economic conditions. With respect to offshore gas discoveries, it also may reduce costs by eliminating the need for pipelines to transport natural gas from offshore wells to the onshore liquefaction plant (the floating liquefaction unit can be positioned on top of the offshore reservoir)

Such technological advances will only further serve to increase global demand for LNG.

___________________________________________________________________________________
About the Gaille Energy Blog. The Gaille Energy Blog (view counter = 64,098) discusses issues in the field of energy law, with periodic posts at www.gaillelaw.com. Scott Gaille is a Lecturer in Law at the University of Chicago Law School, an Adjunct Professor in Management at Rice University’s Graduate School of Business, and the author of three books on energy law (Construction Energy Development, Shale Energy Development,and International Energy Development).